Contact us
Contact us
Contact us
We’re Here to Help You
We’re Here to Help You
Have a question or need assistance with our templates and components? Reach out to our dedicated support team.
Have a question or need assistance with our templates and components? Reach out to our dedicated support team.

Get in Touch
Feel free to reach out - we'd love to connect.
Get in Touch
Feel free to reach out - we'd love to connect.
Get in Touch
Feel free to reach out - we'd love to connect.


Get Membership with unlimited template
Unlock the full potential of your designs with a membership that offers unlimited access to our entire library.
Get Membership with unlimited template
Unlock the full potential of your designs with a membership that offers unlimited access to our entire library.


Get Membership with unlimited template
Unlock the full potential of your designs with a membership that offers unlimited access to our entire library.
Frequently Asked Questions
Unlock the full potential of your designs with a membership that offers unlimited access to our entire library of premium templates and components.
Frequently Asked Questions
Unlock the full potential of your designs with a membership that offers unlimited access to our entire library of premium templates and components.
Frequently Asked Questions
Unlock the full potential of your designs with a membership that offers unlimited access to our entire library of premium templates and components.
What is the Elliott Waves + Liquidity Indicator?
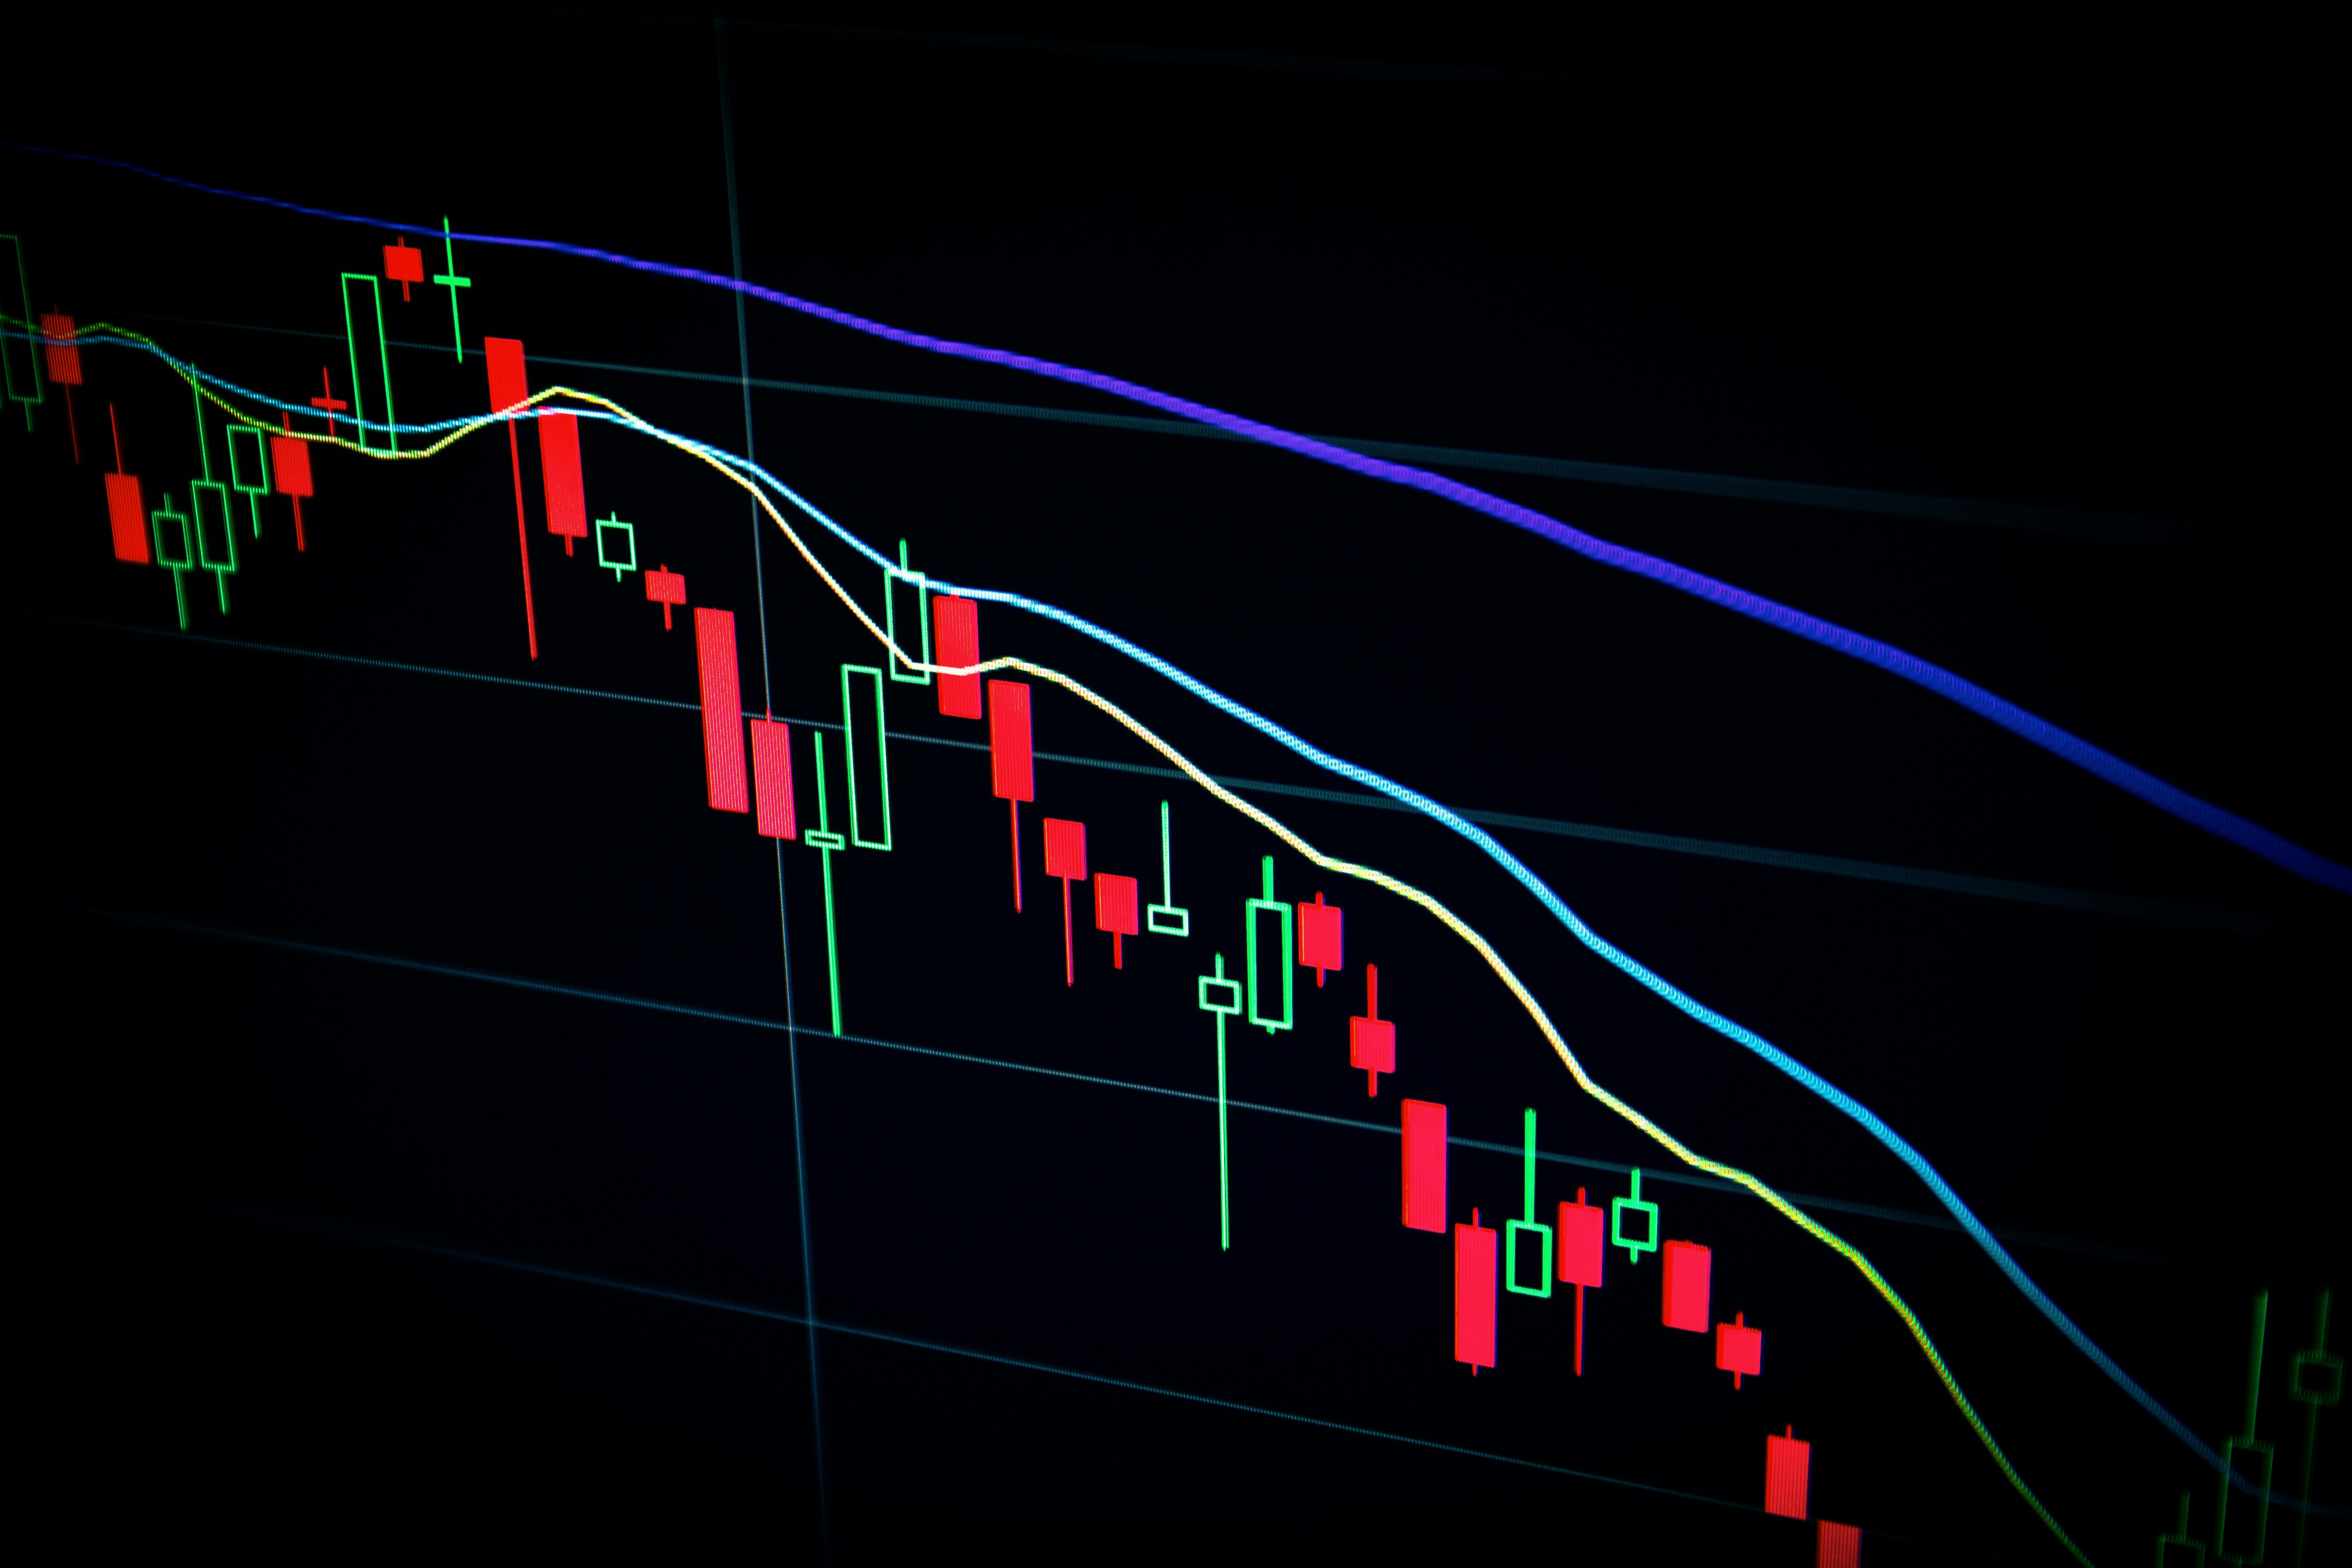
The Elliott Waves + Liquidity Indicator provides an advanced market structure visualization by integrating Elliott Wave pattern recognition with liquidity analysis. Designed for traders requiring detailed insights, it systematically detects wave formations, identifies liquidity voids, and maps critical market levels across multiple timeframes.
What do I get with the Compass Pro Plan?
• Automatically identifies Elliott Wave patterns (1-2-3-4-5) and ABC corrective structures. • Detects liquidity voids with clear bullish and bearish visual cues.
Can this indicator predict future price movements?
This indicator is best suited for higher timeframes and works best when combined with other tools. While it provides valuable market structure insights, it does not predict future price movements. Some elements may repaint as new data comes in, so it’s primarily designed for historical analysis and visualizing market structure.
What customization options are available?
Source settings for wave detection (e.g., high/low prices or open/close values). ZigZag lengths, colors, and visibility. Fibonacci retracement levels. Liquidity void thresholds and colors. Trendline validation and angle restrictions. Visual style preferences.
Is this indicator suitable for all markets?
Yes, the indicator can be applied to various markets, including stocks, forex, and cryptocurrencies. However, its effectiveness may vary depending on market conditions.
What is the Elliott Waves + Liquidity Indicator?
The Elliott Waves + Liquidity Indicator provides an advanced market structure visualization by integrating Elliott Wave pattern recognition with liquidity analysis. Designed for traders requiring detailed insights, it systematically detects wave formations, identifies liquidity voids, and maps critical market levels across multiple timeframes.
What do I get with the Compass Pro Plan?
• Automatically identifies Elliott Wave patterns (1-2-3-4-5) and ABC corrective structures. • Detects liquidity voids with clear bullish and bearish visual cues.
Can this indicator predict future price movements?
This indicator is best suited for higher timeframes and works best when combined with other tools. While it provides valuable market structure insights, it does not predict future price movements. Some elements may repaint as new data comes in, so it’s primarily designed for historical analysis and visualizing market structure.
What customization options are available?
Source settings for wave detection (e.g., high/low prices or open/close values). ZigZag lengths, colors, and visibility. Fibonacci retracement levels. Liquidity void thresholds and colors. Trendline validation and angle restrictions. Visual style preferences.
Is this indicator suitable for all markets?
Yes, the indicator can be applied to various markets, including stocks, forex, and cryptocurrencies. However, its effectiveness may vary depending on market conditions.